The ChartBoot for WordPress plugin makes it easy to add a wide variety of charts to your site’s pages and posts. The available styles depend upon the kind of data you paste into the initial text box. You can create simple bar charts, line charts and pie charts, or if you include a date and several variables, you can create an interactive “trend” chart. Each chart can be easily customized with headers, fonts, and colors.
Getting Started
You can access Chartboot from the Classic toolbar:
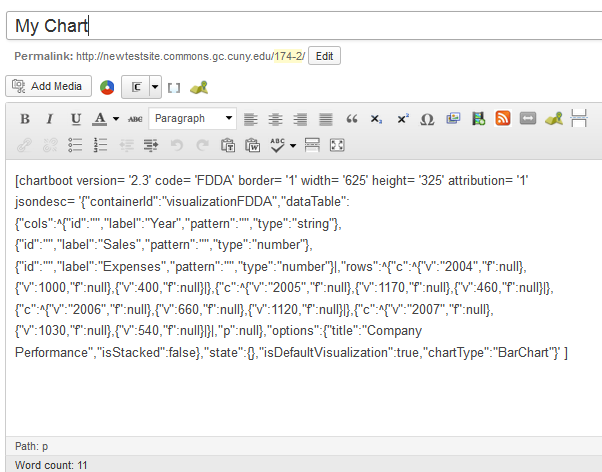
After clicking the icon you will see the edit screen:
Follow the four steps below to create a chart:
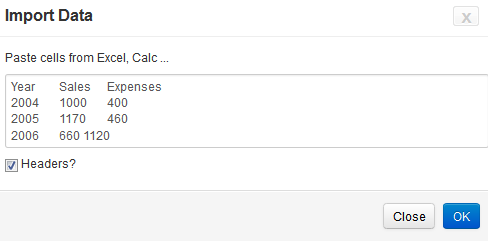
Import Data
Your data needs to be in some kind of spreadsheet. Copy the data, including the headers, but you probably will not want the totals. Paste your data into the text box shown on the right.
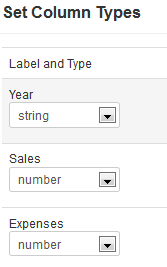
This screen will automatically show your data field names – use the drop down to configure whether the field is text (“string”), number, or date.
Set Types
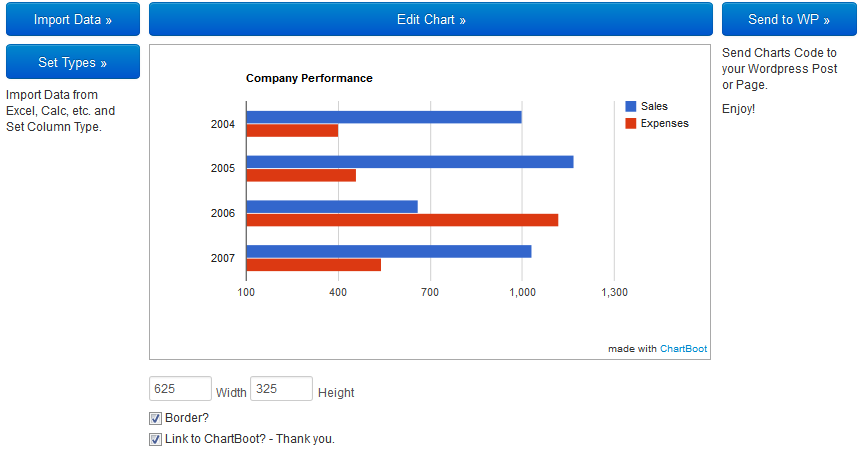
Edit Chart

The plugin does a brief analysis of your data and provides some recommended chart types. You can pick one of these, or click “More” for more options. Your data will not support all chart types, and if you pick one that will not work, you’ll get an error message. When you select a box, your potential chart will appear in a preview box on the right. The subsequent tabs on this screen let you customize a chart to your liking. Features include heading, font size and family, background colors, and axis choice. Make your choice and view how they look on the preview box.
Send to WP
This is the final step in the process. When you click the box, the plugin generates the shortcode that creates your chart. Make sure you are happy will all the steps above, since you’ll not be able to go back to the plugin’s API to edit your chart once it is generated. You could try to decipher the shortcode and modify it, if you know what you are doing, but more likely you will find it easier to just start fresh and repeat the steps above. Here is the shortcode generated for the sample chart: