
Getting Started
This document assumes that you are using an older version of Google Analytics called Universal Analytics (aka Google Analytics 2 or 3). If you are using the newer Google Analytics 4, please use these instructions.
Site admins can set up Google Analytics on their sites to gather and analyze site traffic. A Google account is required. To get started, log into your Google account and go to Analytics – https://analytics.google.com. You should see the following:

 Click on the Sign up button to create a free Analytics account.
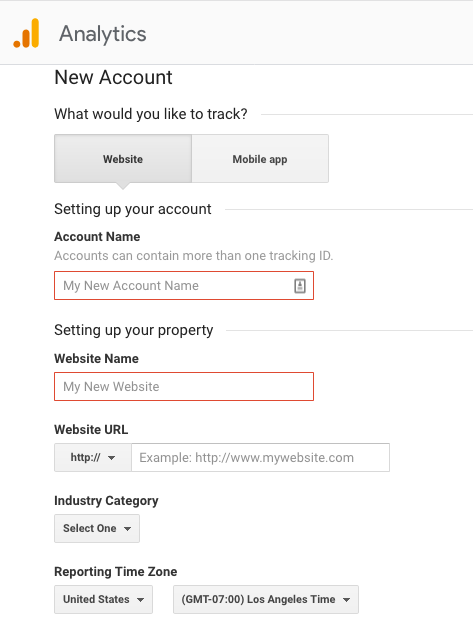
Enter your Account Name (free form – can just be your name), Website Name (this is the title of your Commons site), and the Website URL. Since all sites on the Commons are use an encrypted protocol, pick https:// in the dropdown. Typically, your URL will look like this:
yoursitename.commons.gc.cuny.edu
If you have a mapped site, enter your domain name rather than your Commons site URL.
Pick an Industry Category and Time Zone and create your Analytics account.
For simplicity’s sake, these instructions will assume you have one site, one account, one user, and one property.
After you have successfully created a Google Analytics account, you should see a screen something like this:
![]()
Note the Tracking ID, circled in red. You need to add this to your Commons site so that Google Analytics will know where to get statistics for your property.
Do Not Use The Global Site Tag. This will not work on Commons sites.
Instead, copy the Tracking ID, go to your Site’s back-end, to Settings>>General, scroll down to Google Analytics ID and paste it in. It should have the format “UA-XXXXXXXX-X.” See below:
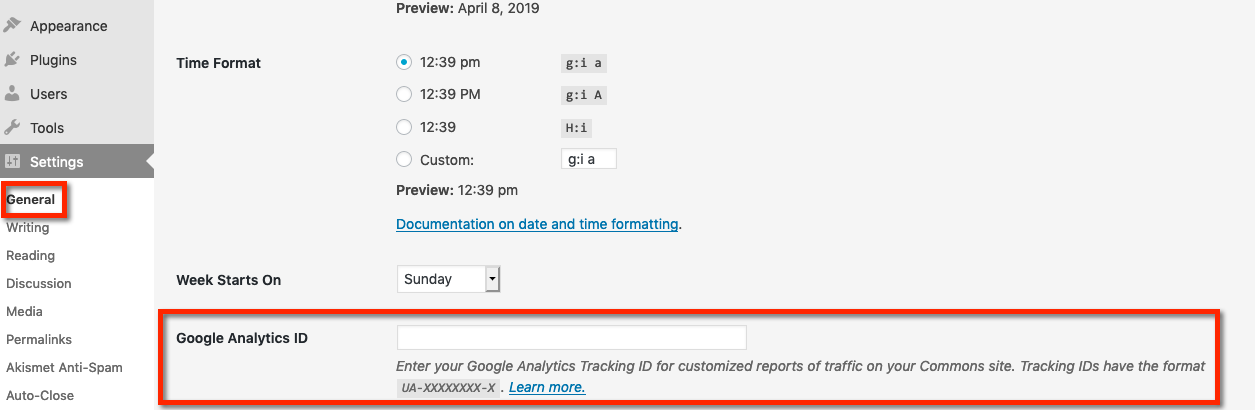
At this point, Google will start collecting statistics on your site.
Next Steps
Google Analytics can be overwhelming. Here are a couple FAQ to get you started:
- statistics can be “real time” (i.e. right now) or for a set period of time
- statistics can be analyzed online or sent via email
- if emailed, they can be sent as PDFs or as spreadsheets (daily, weekly, or monthly)
- many “canned” reports are available
- you can create custom reports if needed, but this requires expertise
- you will not be able to see data before you plugged in your tracking ID
- if you remove your tracking ID from your Commons site, Google will stop providing statistics
It is beyond the scope of this document to “teach” Google Analytics.
A Typical Report
Here is how to create a simple “Content Drilldown” report that may provide most statistics that you need. It shows the number of total number page views as well as the most popular 10 pages of the month. (Ten pages is the default, but you can change this to any number.)
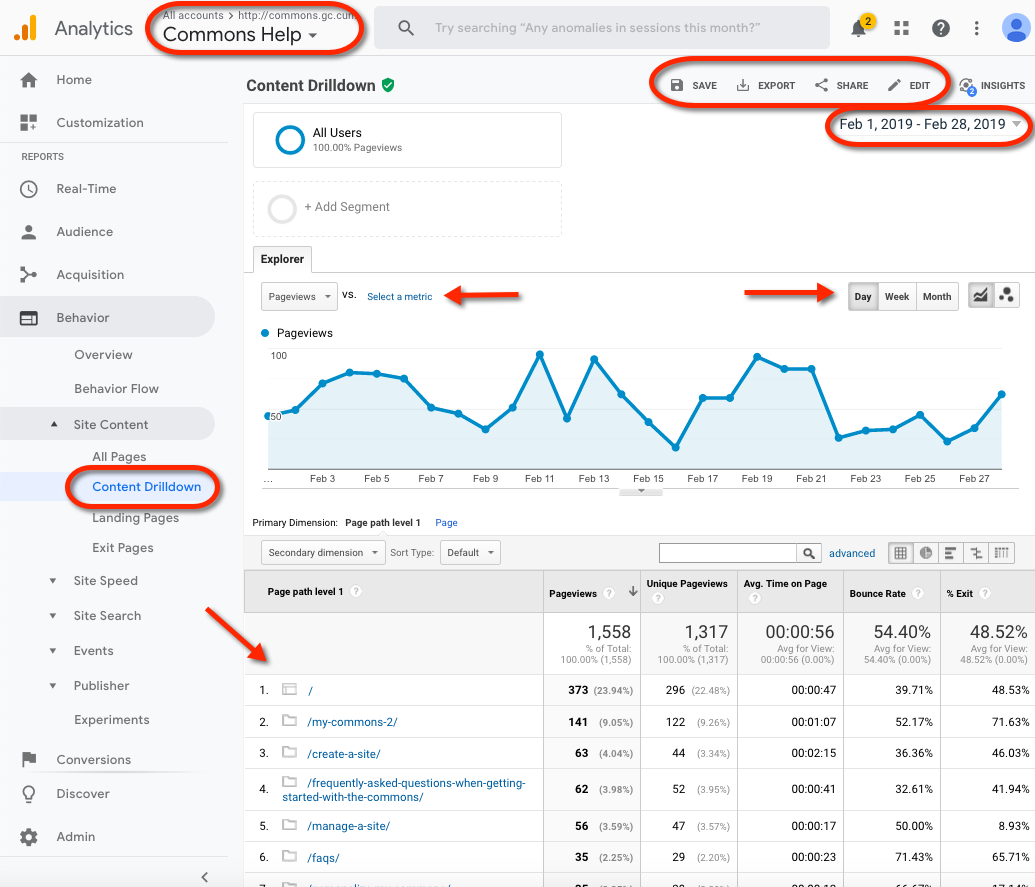
We have chosen a specific time duration – February 1 thru February 28. We have chosen to see the analytics by day (rather than week or month). To create a recurring, monthly report, click on the share icon, enter email recipients, frequency, and format.
As you can see, there are many configurations for even this most basic report. For example, you can add another dimension to the report by comparing “Pageviews” to say, “Bounce rates.”
Feel free to experiment with all Google Analytics has to offer.
Help With Google Analytics
There are many help resources available. Here is a basic video: